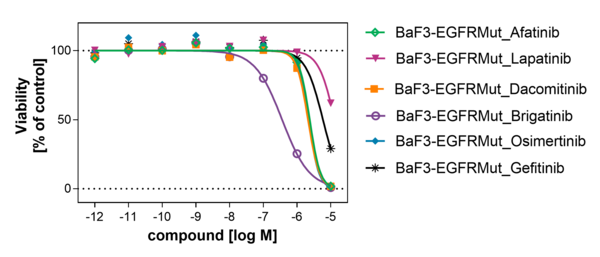
BaF3 Cell Proliferation Assay with EGFR (d746-750/T790M/C797S) for compound screening on the effects of kinase signaling on cell proliferation in transformed pro-B-cells
Epidermal growth factor receptor (EGF-R) is a 179kDa membrane-bound glycoprotein expressed on the surface of epithelial cells. EGF-R is a member of the growth factor receptor family of protein tyrosine kinases. Ligand dependent receptor activation results in autophosphorylation of the receptor’s intracellular kinase domain. Genetic alterations which impact upon the activation level of EGF-R, result in cell proliferation. Therefore, this process is responsible for cellular transformation and makes EGF-R a preferred cancer-related therapeutic target.
EGFR (d746-750/T790M/C797S) (human, full-length)
EGF-R, ERBB, mENA, ERBB1
Pro-B-cell line BaF3 stably expressing transgenic human full-length EGF protein triple mutant d746-750/T790M/C797S.
The overexpression of receptor tyrosine kinases enables the interleukin 3-dependent BaF3 cell line to grow without the supplement of interleukin 3. The inhibition of the activity of the transforming kinase leads to the loss of growth stimuli resulting in cell apoptosis.
Cell Titre Glo readout of cell proliferation
Freiburg, Germany
More information can be found on our website BaF3 Cell Proliferation Assay
Comparison of EGFR inhibitors in a BaF3 cell line expressing EGFR (d746-750/T790M/C797S)

The interleukin 3-dependent pro-B-cell line BaF3 stably expresses human EGFR (d746-750/T790M/C797S) resulting in transformed populations growing independently of interleukin 3 supplements.
Cells were seeded into a multiwell plate with a cell culture medium supplemented with FCS in the absence of interleukin 3. On the next day, the inhibitor was added. After incubation for 72 h, cell proliferation was quantified via CellTiterGlo reagent (Promega) by measuring luminescence with the Envision Multilabel Plate Reader.
The high and low values for IC50 value determination were DMSO-only high control and Staurosporin treatment low control.
| Compound | IC50 (M) |
|---|---|
| Dacomitinib | 2.1e-06 |
| Afatinib | 2.4e-06 |
| Osimertinib | 2.2e-06 |
| Lapatinib | 1.3e-05 |
| Gefitinib | 5.9e-06 |
| Brigatinib | 3.6e-07 |