Cellular Phosphorylation Assay Services
The Cellular Phosphorylation Assay quantifies changes in the phosphorylation status of a substrate as a result of treatment with your inhibitor in intact cells. The assay was designed to address compound activity in a physiological environment on a physiological substrate and is one of two cell-based kinase assays we offer besides the NanoBRET Target Engagement Intracellular Kinase Assay.
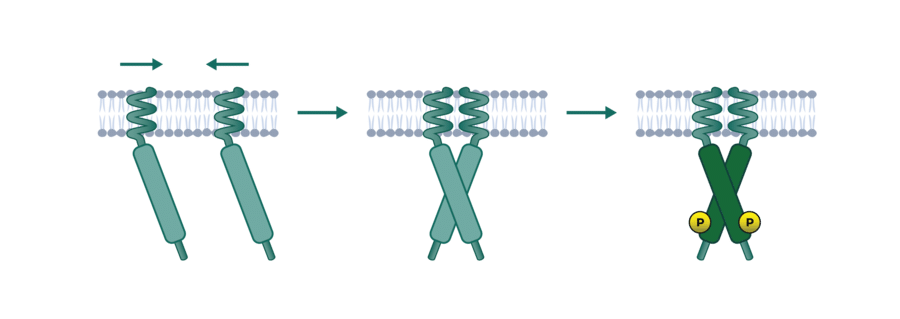
The assay is available with either an endogenously expressed target kinase or with transduced cells for overexpression of the kinase of interest. Cells are preincubated with the compound to allow thorough target binding. To perform substrate phosphorylation some kinases are constitutively active and some kinases need to be activated with incubation of a ligand. After stopping the reaction by cell lysis, the substrate phosphorylation is quantified via ELISA assay.
- Physiological kinase, substrate, and ATP concentrations
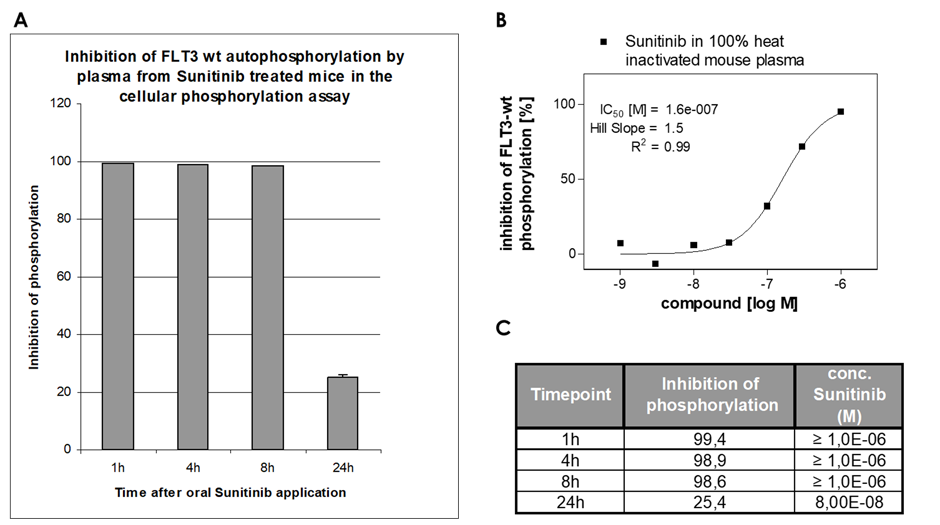
- The assay can be performed with animal blood containing the drug for plasma-inhibitory study after in vivo administration
- Deliverable: % inhibition of kinase activity and IC50 determination
- The testing of compound-target engagement can be performed with our NanoBRET Target Engagement Intracellular Kinase Assay