Aurora-B Cellular Phosphorylation Assay (intracellular kinase activity assay) for compound screening and profiling in intact cells
Aurora kinases are cytosolic serine-/threonine kinases which are highly conserved in eukaryotes and involved in many processes during cell division. Three Aurora kinases have been identified in humans and designated as Aurora-A, -B, and -C. Aurora-B localizes at the kinetochore from G2 to metaphase, and relocates to the midbody after anaphase. Aurora-B plays roles in spindle dynamics, chromosome condensation, and cytokinesis. Overexpression of Aurora-B is frequently observed in various human cancer tissues and cells overexpressing Aurora-B are tumorigenic in nude mice. Inhibitors of Aurora-B kinase activity such as VX-680 are developed for therapeutic application.
AURKB
AurB, AIK2, AIM1, ARK2, AurB, IPL1, STK5, AuroraB, Aurora B
HT-29
Endogenous
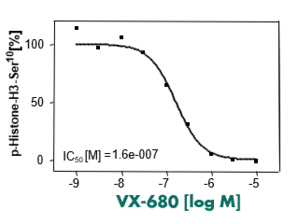
Using HT-29 colon carcinoma cells, this cellular screening system monitors the phosphorylation level of HistoneH3 at Ser10, the direct downstream target of endogenous Aurora-B. To boost the phospho-Histone-H3 signal, phosphatase inhibitor Calyculin is added prior to cell lysis. Using this assay, we could successfully translate the effect of many Aurora-B inhibitors such as VX-680 on endoreduplication into decreased levels of phospho-HistoneH3-Ser10 which was quantitated via direct ELISA (see. Fig.1).
Substrate phosphorylation as a readout of intracellular kinase activity via ELISA
Freiburg, Germany
More information can be found on our website Cellular Phosphorylation Assay Services.
Primary reference compound IC50 for Aurora-B
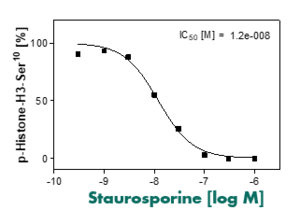
Staurosporine block Aurora-B and inhibit the cellular phospho-Histone-H3-Ser10 signal with highly reproducible IC50 values. The graph shows the results of representative experiments.
Additional validation data