T Cell Assays
Immuno-Oncology Platform

T Cell Assays

Our T cell assays are designed to characterize T cells via T cell proliferation assays, T cell activation assays, and T cell cytotoxicity assays, or monitoring T cell differentiation via immune markers.

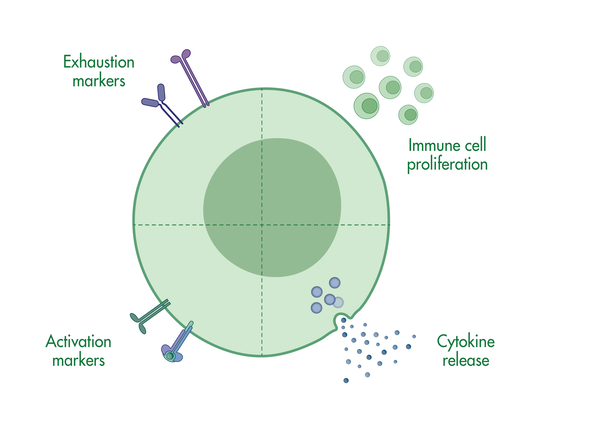
T cells reside in peripheral tissue or circulate in the body until they recognize their antigen on the surface of an antigen-presenting cell. The interaction with the antigen-presenting cell sets a complex response in motion. Our T cell assays are designed to understand which signals trigger a response and to characterize this response.

T cell assays at Reaction Biology include:

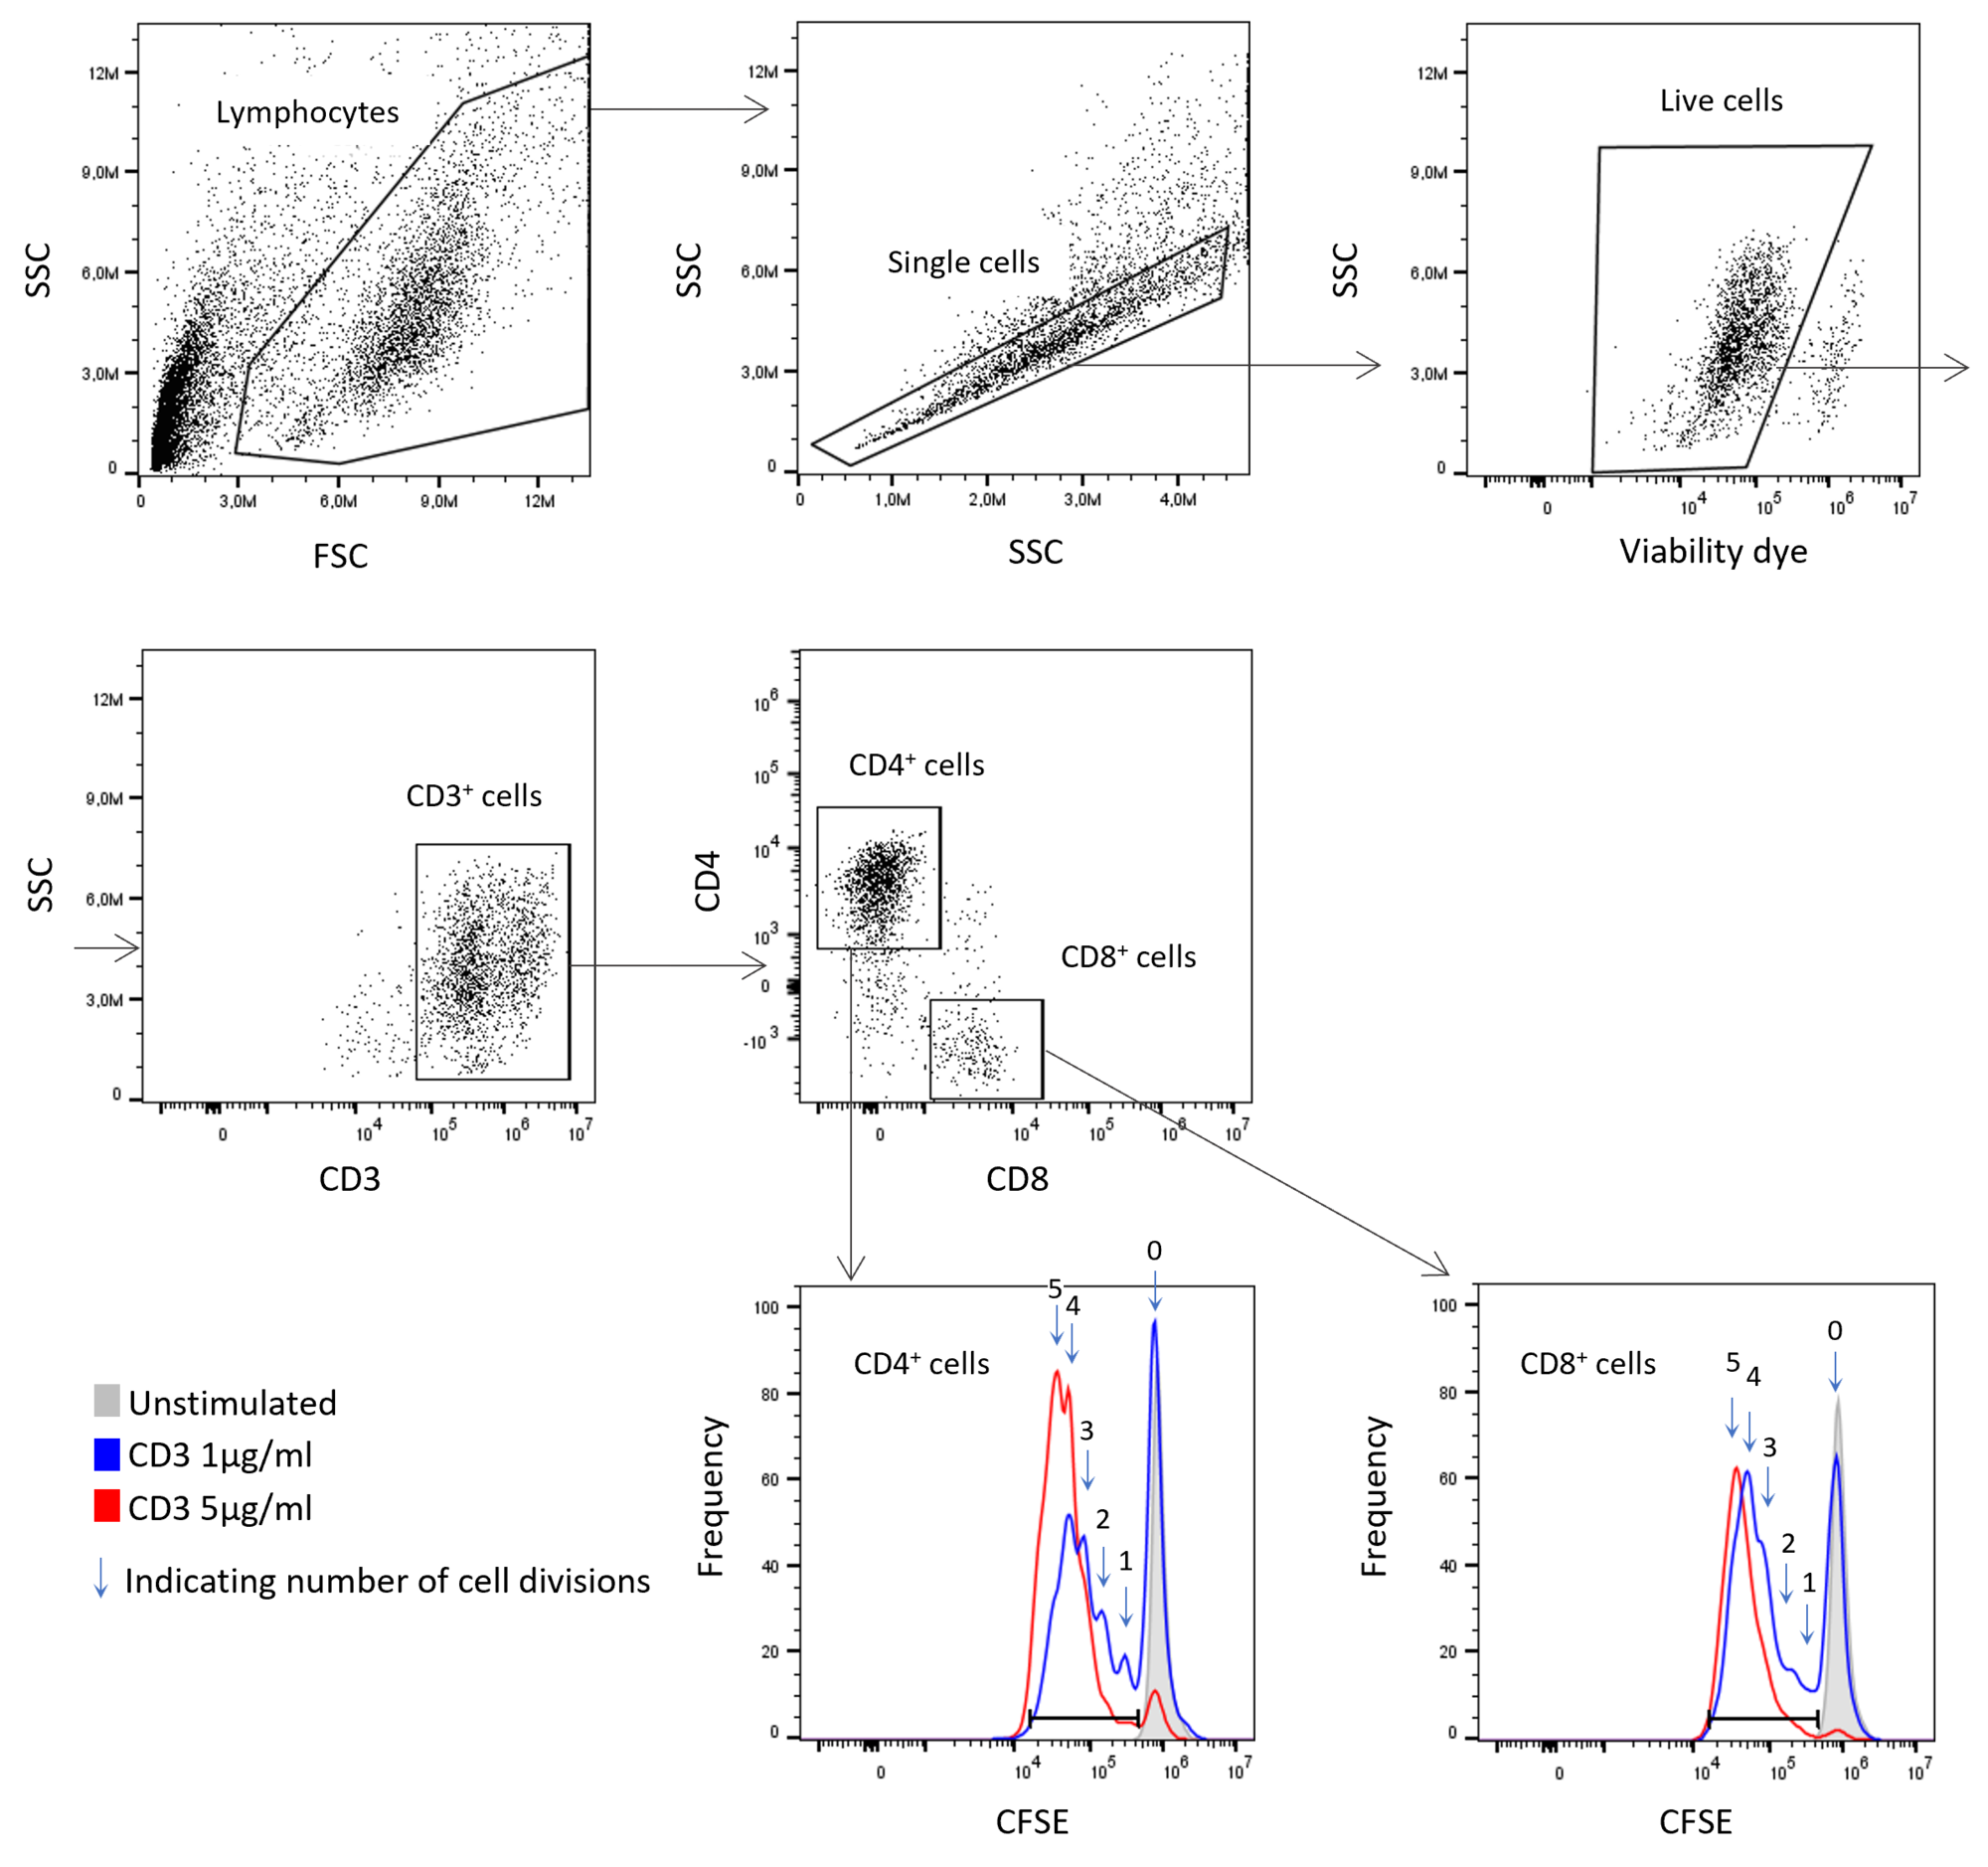
  • T cell proliferation assays to monitor the expansion of T cells after activation
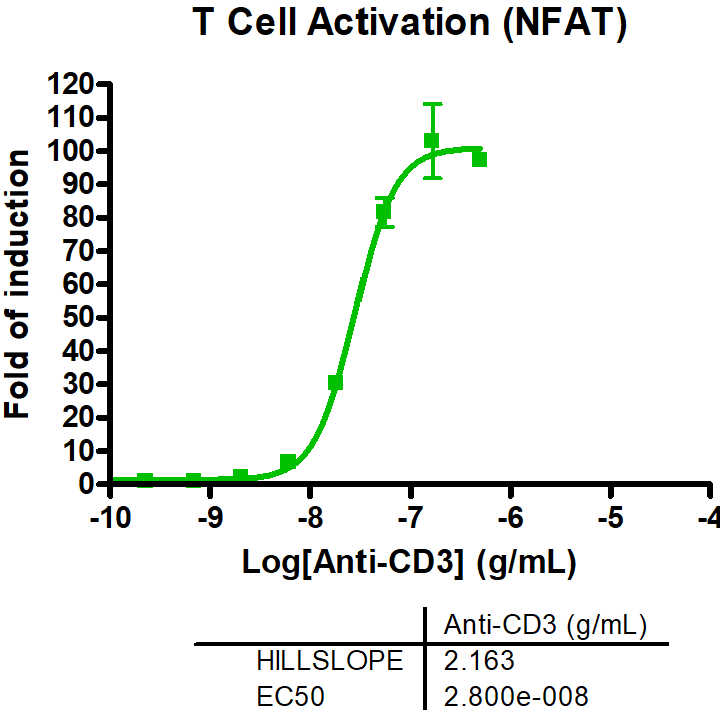
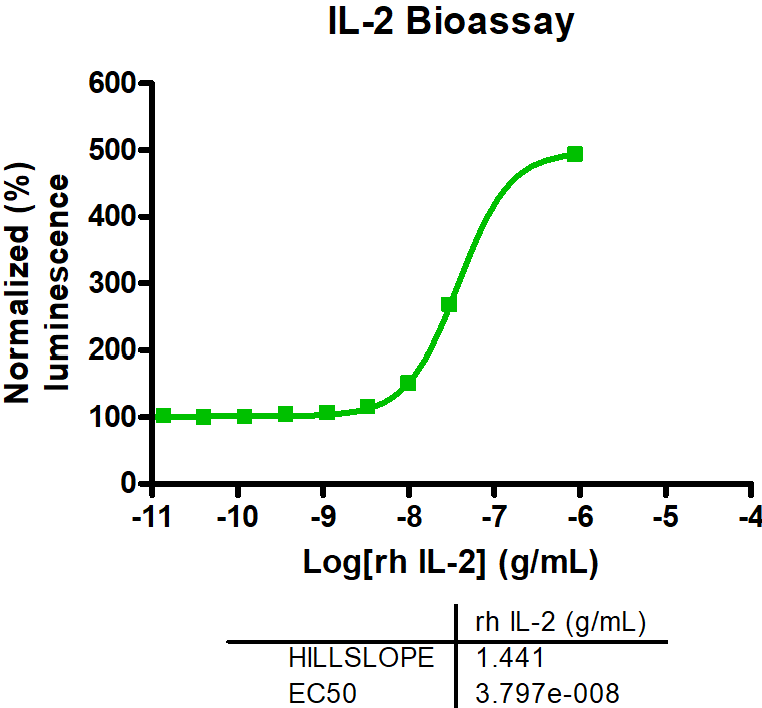
  • T cell activation assays to monitor hallmarks for T cell activation, including cytokine release and immune surface markers
  • T cell cytotoxicity assays measuring the number of cytokine-secreting cells via ELISpot

Please reach out today and discuss directly with our scientists how we can help you best to characterize your new immunotherapeutic agent.

T Cell Assays

T cell assays help understand what is happening after T cells engage with antigen-presenting cells and how an immune-modulating drug skews this response, such as

  • Immune cell proliferation
  • Cytokine release
  • Activation marker expression
  • Exhaustion marker expression.

Example Studies of T Cell Characterization Available at Reaction Biology

  • T Cell Activation Bioassay
  • T Cell Proliferation Assay
  • IL-2 Bioassay (to measure IL-2 stimulation or inhibition)
  • Characterization of donor PBMCs
T Cell Activation Bioassay

T cells play a central role in cell-mediated immunity and can mediate long-term, antigen-specific, effector, and memory responses. Enhancing and engineering T cell responses to alter T cell functional capability has shown promise in the treatment of diseases like cancer and autoimmune diseases. The activation of naïve T cells by an antigen and costimulatory signals initiates clonal expansion of both CD4+ helper and CD8+ cytotoxic T cells. Engagement of the T cell antigen receptor (TCR)/CD3 complex and co-stimulatory receptor CD28 initiate intracellular signaling events and the activation of nuclear transcription factors such as the Nuclear Factor of Activated T cells (NFAT), NF-kB, and AP-1.

Setup
We employ engineered Jurkat T cells that stably express a luciferase reporter driven by an NFAT response element. When the TCR/CD3 effector cells (NFAT) are engaged with an appropriate TCR/CD3 ligand or anti-TCR/CD3 antibody, the TCR transduces intracellular signals, resulting in NFAT-RE-mediated luminescence. The bioluminescent signal is then detected and quantified using the Bio-Glo Luciferase assay system, which measures the potency of TCR constructs to activate T cells.

We have developed a systemic approach to T cell activation for drug discovery. T-cell activation can be checked by the expression of a luciferase reporter driven by either an NFAT response element or an IL-2 promoter. Both cell lines are available for assessing T cell activation by employing bioluminescent methods or ELISA kits.

Example data

Representative data for the T cell activation bioassay.

T Cell Proliferation Assay

Tracking of T cell division via CFSE after activation via plate-bound anti-CD3 antibody 

Assay principle

T cell proliferation is one of the hallmarks of successfully activated T cells. Carboxyfluorescein succinimidyl ester (CFSE) is a cell-permeable dye that binds covalently to intracellular molecules and is retained within cells for very long periods. The intensity of CFSE in cells can be measured by flow cytometry. With each cell division, the intensity halves, enabling the identification of proliferating cells.

Setup

PBMCs are plated in multi-well plates coved with anti-CD3 antibodies, which engage the T cell receptor, triggering T cell activation and expansion. CFSE dye is used to track cell division by measuring CFSE intensity in the cells.

Results

Healthy donor PMBCs were labeled with CFSE and either cultured in the presence of two different concentrations of plate-bound anti CD3 (OKT3) or left untreated. After 5 days, cells were harvested, stained with a fixable viability dye and surface markers (CD3, CD4, and CD8), and fixed with 4% PFA. Cells were acquired using a Cytoflex S (Beckman Coulter).

IL-2 Bioassay (to measure IL-2 stimulation or inhibition)

Introduction

IL-2 is crucial for the generation, maintenance, and expansion of CD4+ regulatory T cells, as well as the cytotoxic activity of NK and CD8+ cells, and it also regulates homeostasis by eliminating harmful autoreactive T cells through activation-induced cell death. IL-2 signals via a receptor complex made up of CD25/IL-2R alpha, IL-2R beta, and the common gamma chain (Gamma C).

Multiple signaling pathways are activated when IL-2 binds to its receptors. Tyrosine kinases JAK1 and JAK3 are two important kinases recruited and activated at receptor cytoplasmic domains by the IL-2 signaling pathway. In turn, these kinases activate the STAT, PI3-AKT, and MAPK signaling pathways, which then mediates proliferation, survival, activation, and differentiation of a variety of immune cell types. IL-2 is approved for the treatment of patients with metastatic melanoma, renal cell carcinoma, and some patients with acute myelogenous leukemia have been successfully treated with high dose of IL-2 making IL-2 an important immunotherapeutic target.

Goal

To quantify IL-2 activation or inhibition

Assay Setup

Genetically engineered IL-2 Bioassay cell lines were stimulated with recombinant human IL-2. After 6 hours of incubation, Bio-Glo Reagent was added, and luminescence was quantified using GloMax discover system.

Example Data

Measuring dose dependent IL-2 receptor mediated signaling when incubated with rh IL-2

Characterization of donor PBMCs

Peripheral blood mononuclear cells (PBMCs) are a mixture of immune cell populations developed in the bone marrow from hematopoietic stem cells. The PBMCs include particularly those with a single round nucleus, composed mainly of lymphocytes, dendritic cells, and monocytes. We isolate PBMCs out of buffy coats, which entail the entire cellular fraction of one blood donation unit.

The material is ideal for the isolation of a large number of immune cells from one healthy donor and allows us to have enough material to isolate rare cell types (like NK cells or monocytes) and to have several frozen vials from the same donor in order to perform different tests with the same cell batch if needed.

Since the frequency of different cell types within PBMCs varies from donor to donor, we performed a broad characterization of the main immune cell populations. With this information, we can choose the best donor for a project depending on the particular need for a certain immune cell population.

Setup

Healthy donor PBMC were isolated from buffy coats after density gradient centrifugation and stored in liquid nitrogen until further use. PBMC were thawed, labeled with a fixable viability dye, and stained for surface markers for T cells (CD3, CD4, CD8), monocytes (CD14), B cells (CD19), and NK cells (CD56).

We also included a Human Leucocyte Antigen Serotype (HLA-A2) marker and stained for HLA-DR, which is expressed on the surface of antigen-presenting cells (macrophages/monocytes, B cells, and dendritic cells) and is upregulated in response to stimuli.

Results

Immune cell population Frequency of viable cells (% of viable single cells)
HLA-A2+ 97 %
HLA-DR+ 54 %
CD3+ 30 %
CD3+ CD4+ 16 %
CD3+ CD8+ 10 %
CD3- 70 %
CD3- CD19+ 6 %
CD3- CD56+ 11 %
CD3- CD14+ 39 %


The frequencies of several immune cell populations in the PBMCs of one donor are shown. Please reach out to inquire about the profiles of other PMBC donors or sources to ensure we align the experiment setup with your research questions.