Microscale Thermophoresis (MST)
Biophysical Assays

MST Assay Service for Drug Discovery

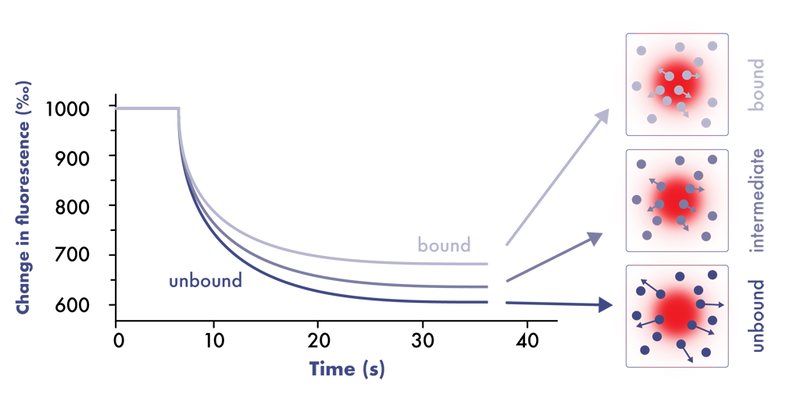
Microscale Thermophoresis assays (MST assays) measure the motion of molecules along microscopic temperature gradients that changes upon ligand binding.

MST assays measure the ligand-target interactions directly in solution without the need for immobilization to a surface (immobilization-free technology). The technique requires low amounts of pure analyte samples and may be compatible with non-purified protein samples and is compatible with most buffers.

Microscale Thermophoresis Assay Methods:

Our MST assay services include:

  • Binding between biomolecules of any type can be investigated including small-molecules, multi-protein complexes, DNA, liposomes, nano-particles and more
  • Fast lead time for assay development and affinity determination
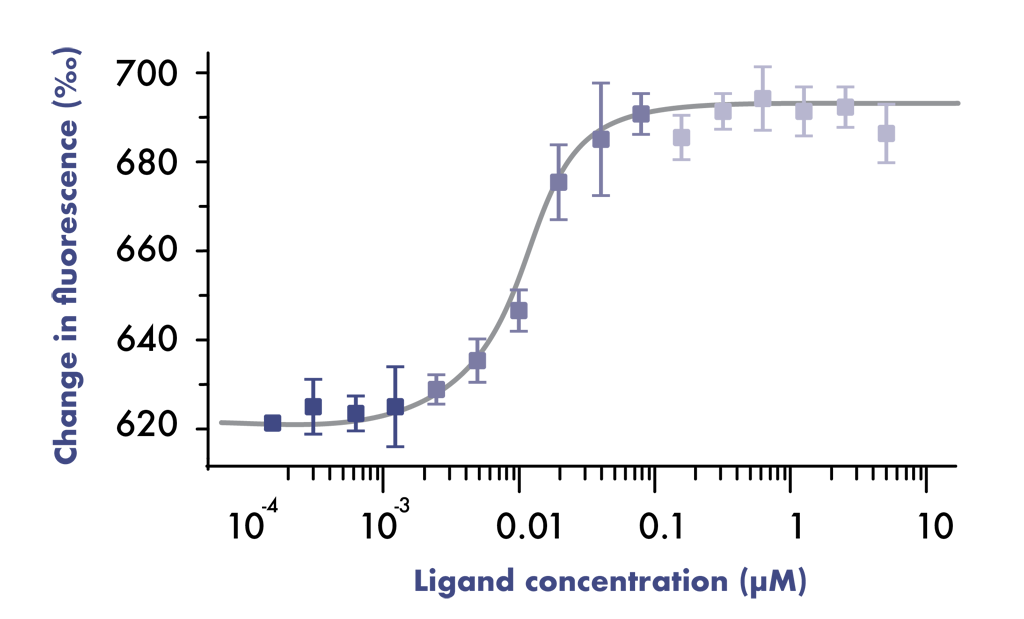
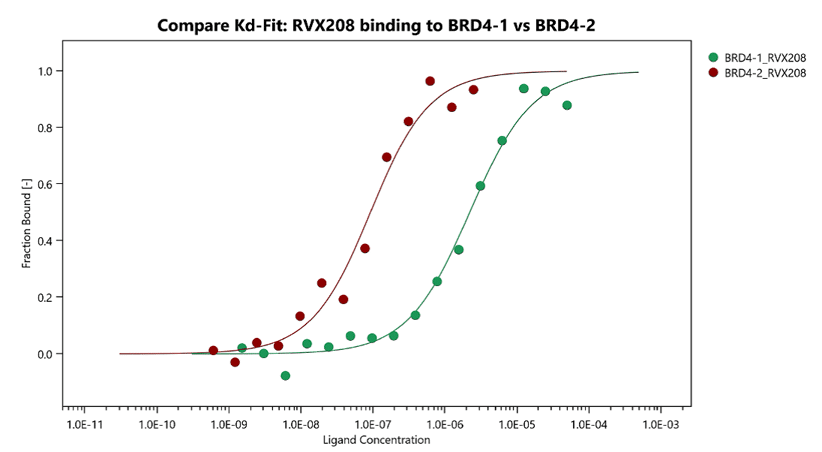
  • Deliverable: dissociation constant KD (binding affinity)

MST Principle

When performing an MST experiment, a microscopic temperature gradient is induced by an infra-red laser, and the movement of fluorescent molecules away from the heated area is monitored. The movement varies depending on whether a ligand is bound to the molecule. The difference in motion is used to calculate binding affinity.

microscale thermophoresis assay drug discovery

microscale thermophoresis assay drug discovery

MST Assay Details

  • Thermophoresis
  • Example: BRD4
  • Screening Details
Thermophoresis

Thermophoresis

example graph of microscale thermophoresis assay probing a compound to bind against a target protein

In a glass capillary, fluorescent molecules are allowed to interact with ligands in various concentrations. Upon laser beam treatment of a distinct area of the capillary, the intensity of fluorescence changes due to the movement of molecules away from the heated area (thermophoresis, also called thermo-migration), which differs when the ligand is bound. Temperature-induced changes in fluorophore properties may also be observed.

Example: BRD4

Example: BRD4

microscale thermophoresis graph example for compound testing for affinity binding to a target

Comparison of a bromodomain inhibitor binding to bromodomain 1 vs bromodomain 2 or BRD4.

MST measurements were performed for two bromodomains of BRD4 protein (BRD4-1 and BRD4-2) in the presence of variable concentrations of the ligand. Determined KDs show a higher affinity of the inhibitor towards the second bromodomain of BRD4.

KD BD1: 2.2E-06M
KD BD2: 8.3E-08M

Screening Details

MST Screening Details

Instruments: Monolith NT.115 pico (NanoTemper) for the detection of binding affinities in the low pM range with the highest sensitivity.

Turnaround time: The study is typically completed within 2-3 weeks after receipt of materials. Projects are performed on a first-come-first-serve basis.

Sample requirements: Protein purity of 85% or more is required. The minimum protein amount is dependent on the storage buffer and labeling technique. The rough estimate is between 100-200 ug.
Please see our FAQ for shipping instructions.

Screening location: The assay is performed in Malvern, PA, USA.