qPCR Service for Drug Discovery
Reaction Biology offers real-time quantitative PCR (qPCR; RT-qPCR) and digital PCR (dPCR) service, providing scientists custom-tailored gene expression analysis and copy number determination including high-quality DNA and RNA isolation. Relative and absolute quantification approaches enable the detection of quantitative differences in mRNA expression of drug targets, PD markers, or predictive biomarkers. Our qPCR platform is set up to support drug discovery projects performed with cellular and animal models at Reaction Biology as well as the investigation of customer samples.
Our qPCR services support numerous applications in the drug discovery process, such as:
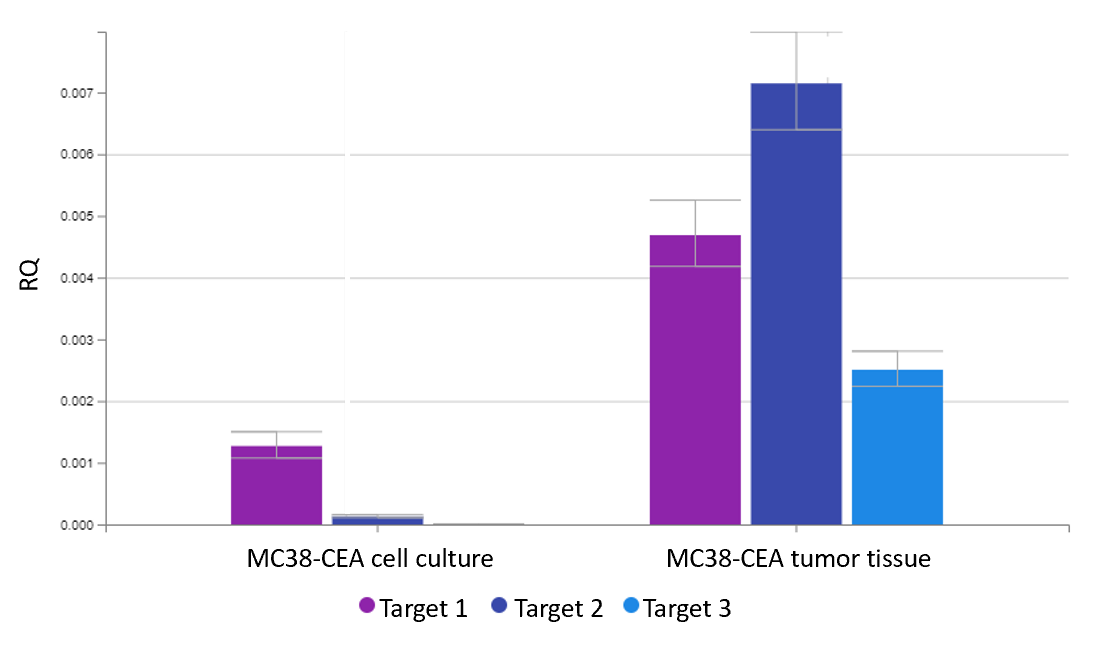
- Quantification of drug target gene expression for the identification of suitable tumor cell lines for drug efficacy testing
- Screening biomarkers to predict a drug’s response in cellular or animal models
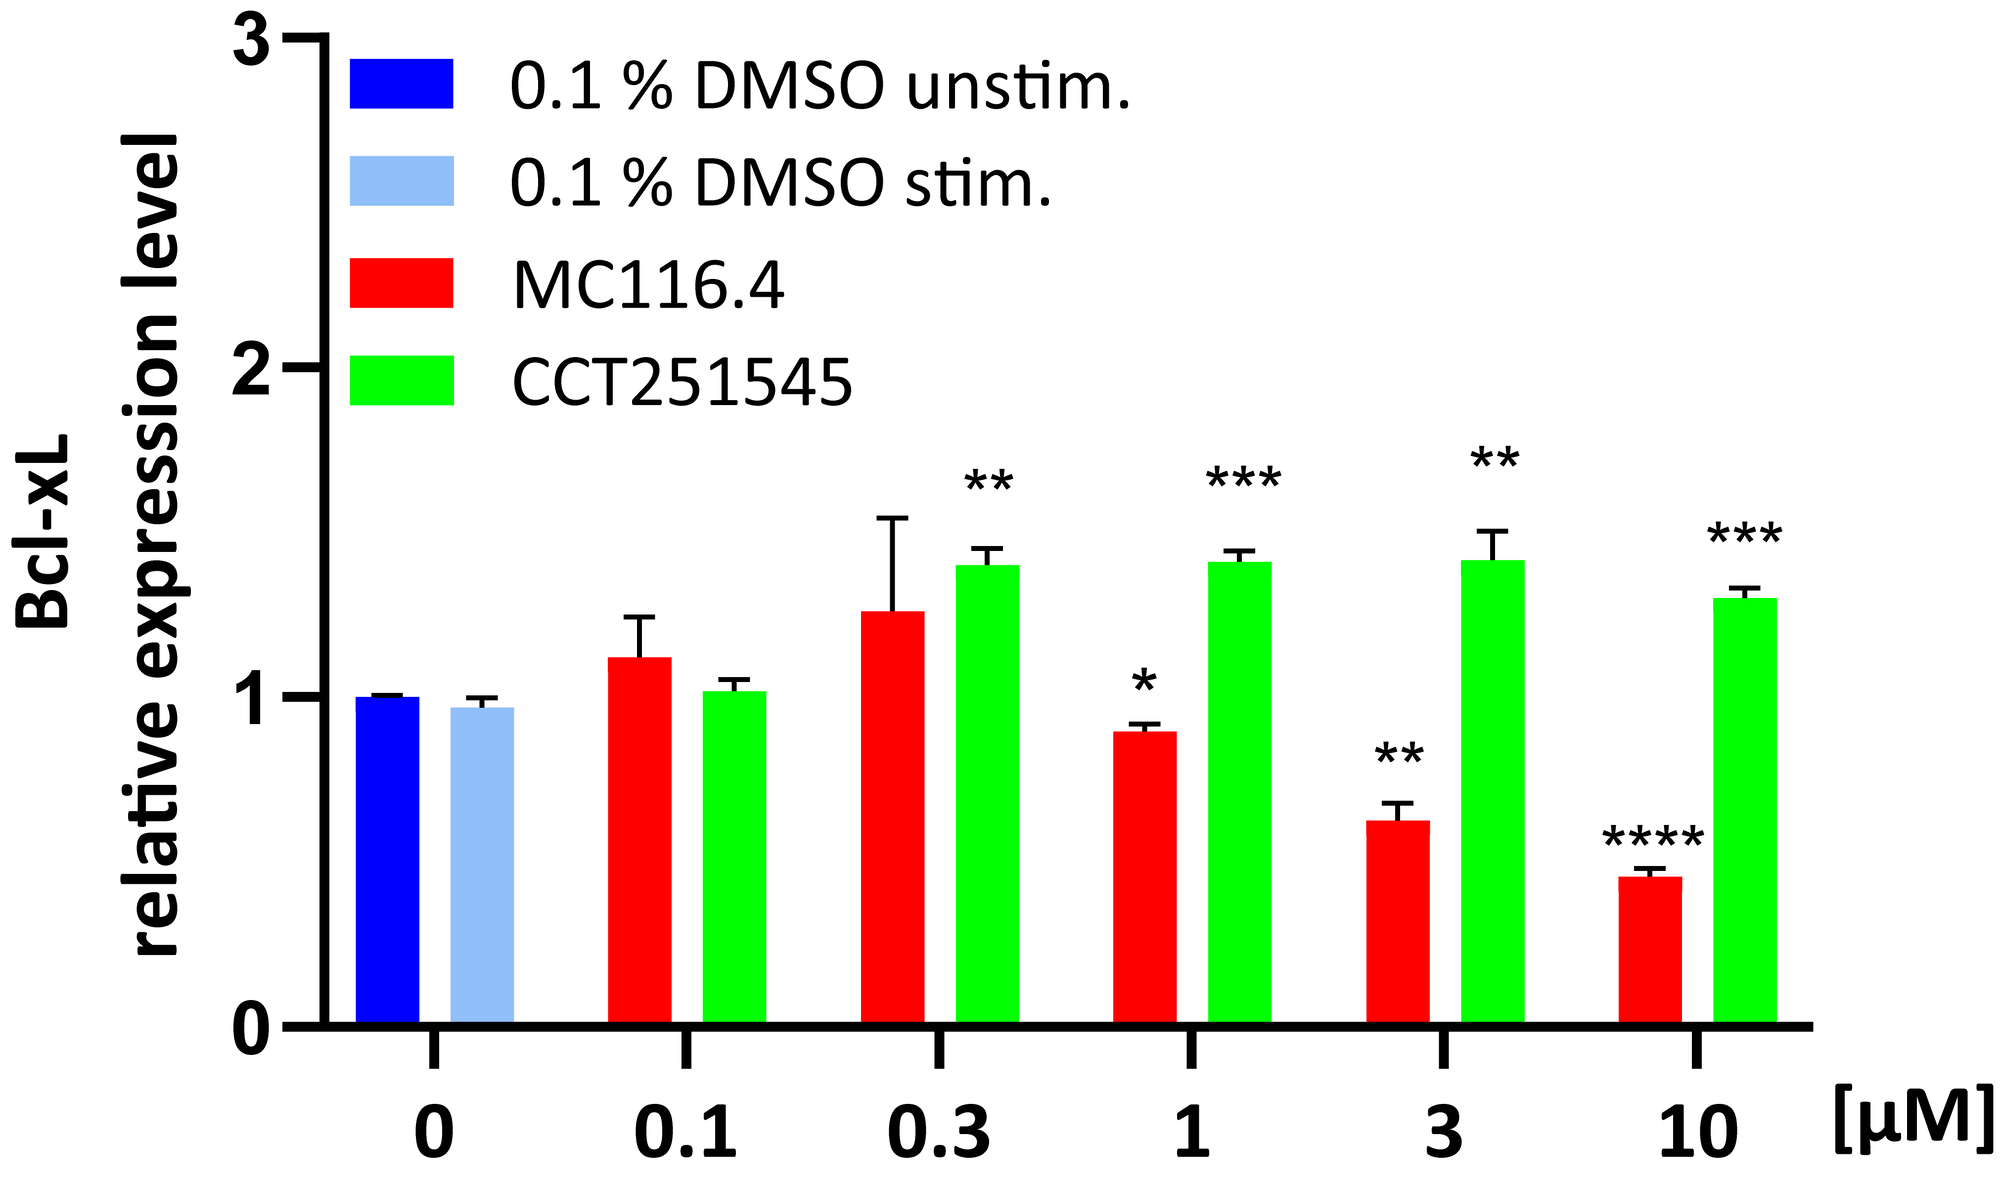
- Determining pharmacodynamic parameters of drugs that affect the expression of specific genes for the determination of time- or dose-dependency and mode of action analysis
- Genotyping for verification of stratification markers
Reaction Biology offers complete in-house services comprising sample generation from our cellular and animal models through the isolation of DNA and RNA.
Our scientists are available for consultation to meet your research needs with custom-designed project layouts. Our QuantStudio 6 Pro Real-Time PCR System from Applied Biosystems allows absolute and relative quantification assays, multiplex assays, and high-throughput projects. Please reach out to discuss your research goals with our scientists.