Surface Plasmon Resonance Assay Services for Drug Discovery
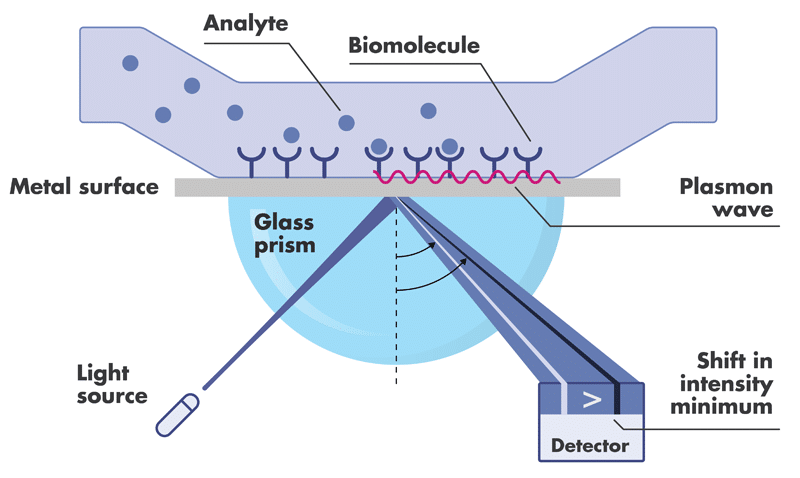
Surface Plasmon Resonance (SPR) is a highly sensitive technique for accurate analysis of the interactions of two biomolecules with respect to binding kinetics and affinity as well as binding specificity.
To perform SPR assays, Reaction Biology is equipped with two state-of-the-art Biacore 8K and two 8K+ instruments with high-throughput compound screening capability and extraordinary detection sensitivity. We perform high-throughput fragment screening, kinetics and affinity determination, binding specificity profiling and antibody characterization, etc.
Reaction Biology provides project-tailored solutions to assure the highest chance of success in biomolecular interaction research using SPR services by using a broad biophysics knowledge base and excellent instrument coverage.
- The SPR binding assay is suitable to advance any analyte including fragments, antibodies, peptides, nucleic acids against any target class including enzymes and non-active proteins
- SARS-CoV-2 S protein and ACE2 receptor binding assay is available here
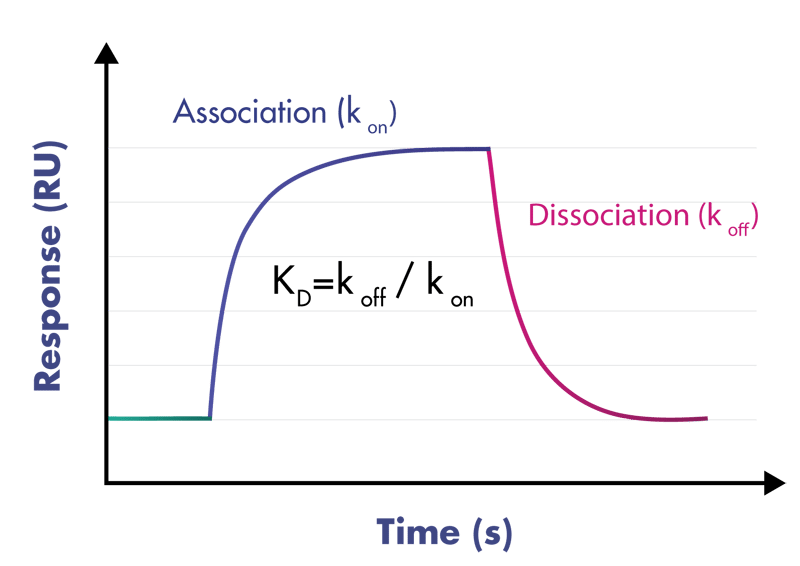
- Deliverables: association rate constant kon, dissociation rate constant koff, binding affinity KD
Our experts have extensive expertise in analyzing and resolving surface plasmon resonance challenges with ‘difficult to test’ proteins. The assay is carried out at Malvern, Pennsylvania, in the United States and performed on a first-come, first-serve basis.