Biomarker Analysis Details
Biomarker analysis at Reaction Biology is performed using a computational tool, the Cancer Data Miner, developed by our collaborator 4HF Biotec, a bioinformatics firm specializing in cancer data mining to discover new anti-cancer drugs.
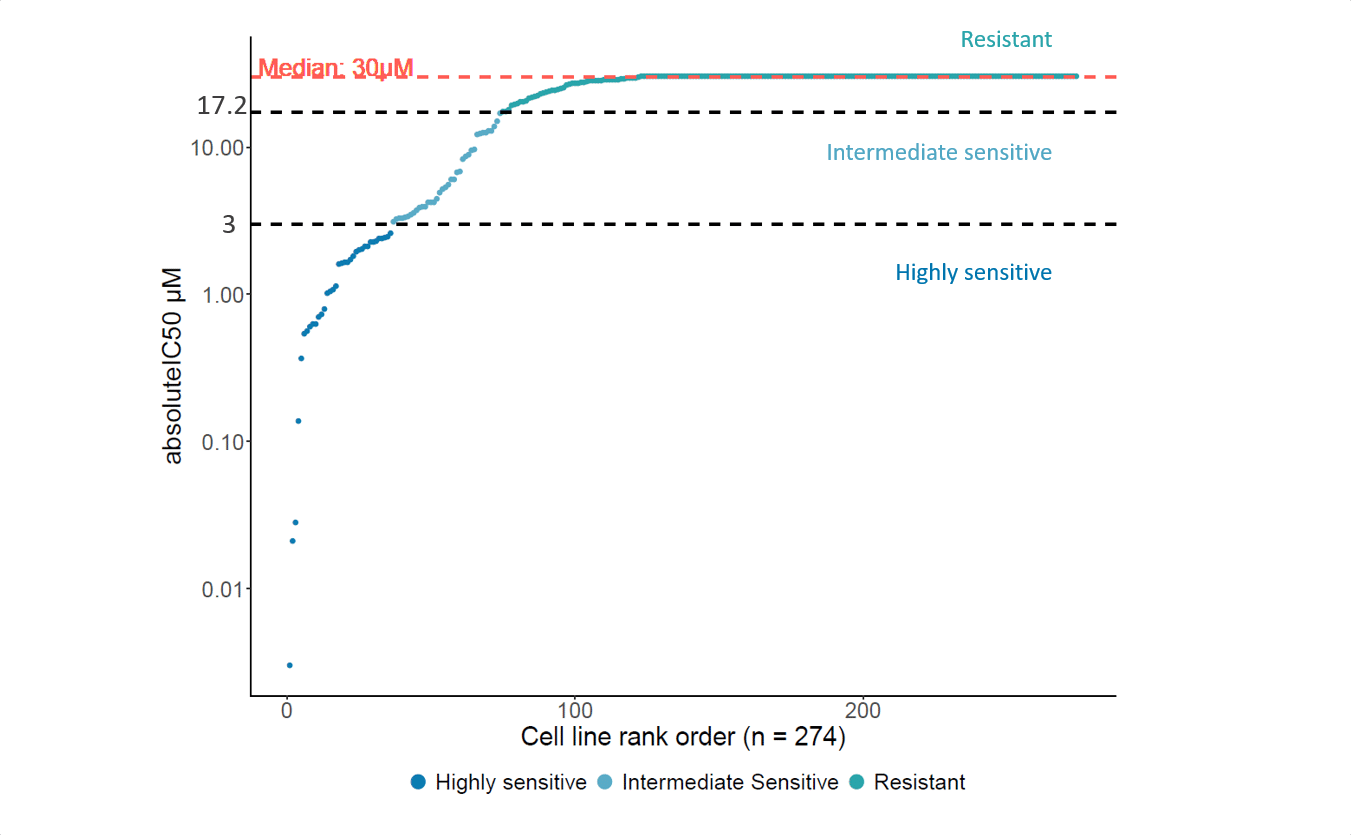
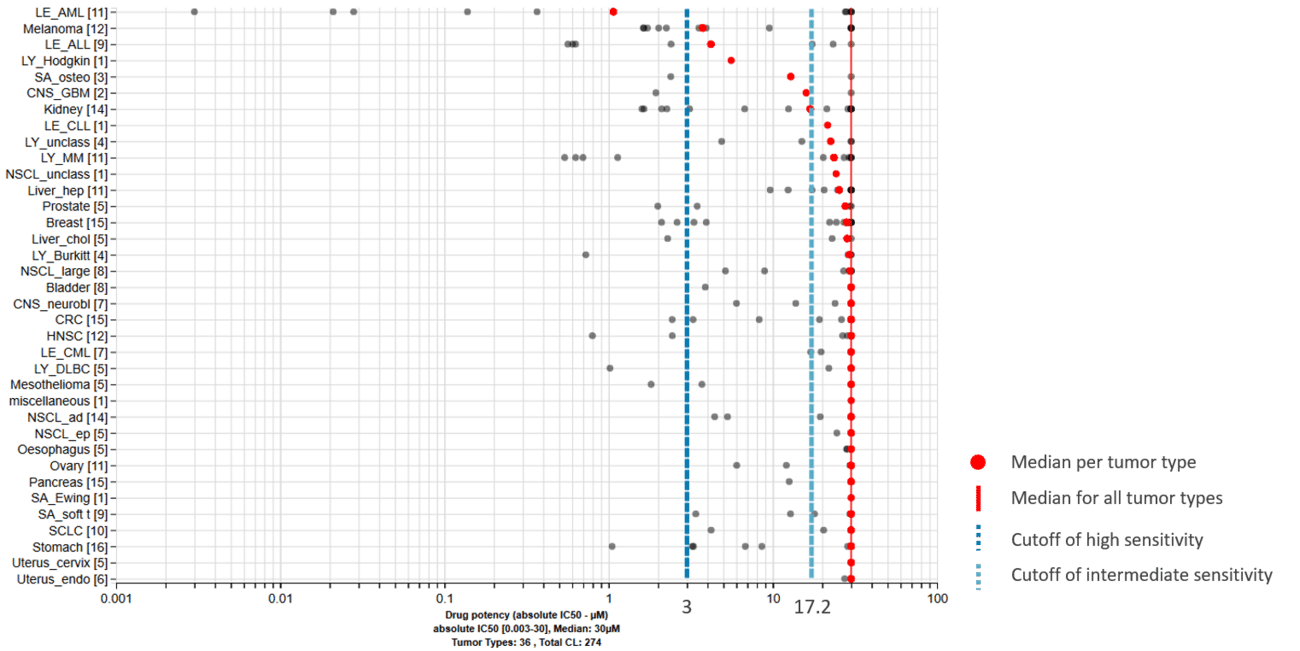
Primary data set: We will perform the ProLiFilerTM assay for testing the anti-proliferative effects of your drug on a set of 140 human tumor cell lines for IC50 determination, also called the ‘sensitivity profile’ of your compound.
Database: Our collaborator 4HF Biotec has built a comprehensive database, including data from more than 1,800 preclinical samples comprising multiple cancer datasets that are integrated into a single platform for visualization and statistical analysis.
The data relevant for the Biomarker Analysis Tool are mutations (whole-exome sequencing), gene copy numbers, and gene expression data (Affymetrix).
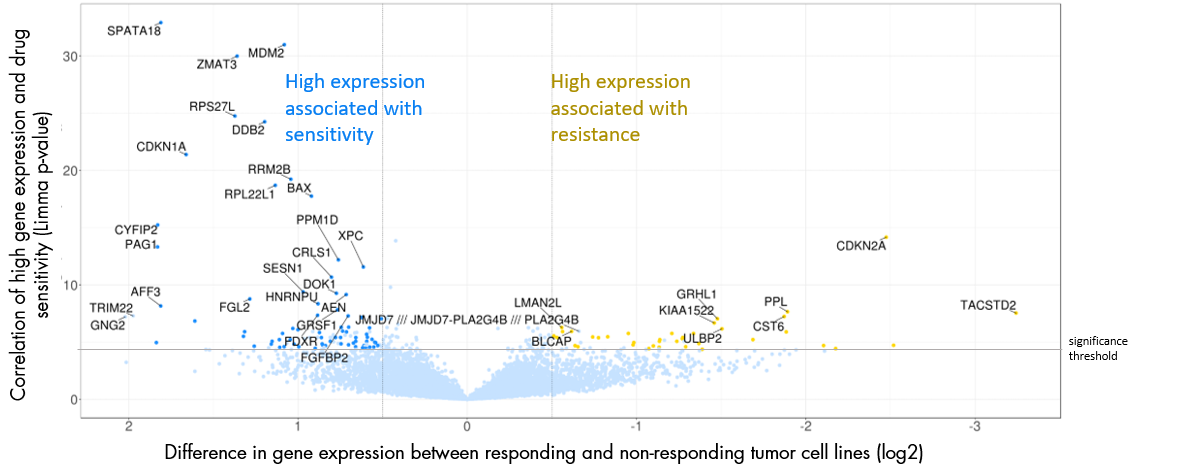
Approach: The ProLiFilerTM results are correlated with the gene expression, mutation, and somatic copy number alteration data of the tumor cell lines that were used in the ProLiFilerTM study. A correlation analysis is performed for each cell line to determine the correlation of the drug sensitivity to each gene in regards to the expression level, mutation status, and/or somatic copy number. Watch the above video for more information.
Analysis: The Biomarker Analysis is performed with two statistical tests for each correlation; one uses the IC50 value of the test drug; and the other compares the gene data of responding and non-responding cell lines.
Deliverables:
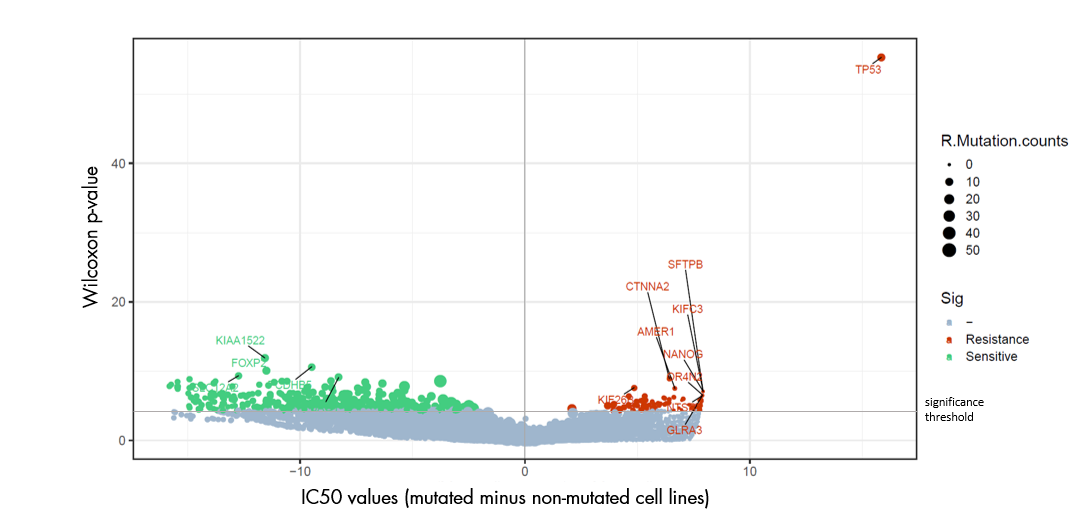
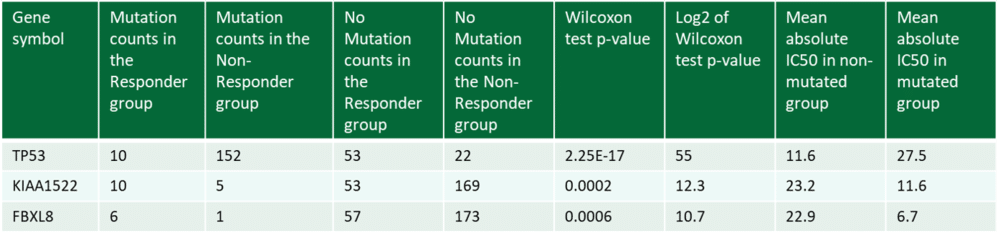
Mutation analysis
- Excel tables with raw data
- Graphical presentation of the correlation of mutation status for each gene and the drug sensitivity for each cell line
- Graphical presentation of the correlation of the position of each mutation and the drug sensitivity for each cell line
- Optional: Presentation of the amino acid position of relevant mutations
Gene copy analysis
- Excel tables with raw data
- Graphical presentation of the correlation of gene copy gain and the drug sensitivity for each cell line
- Graphical presentation of correlation of gene copy loss and the drug sensitivity for each cell line
- For selected genes, additional plots can be generated
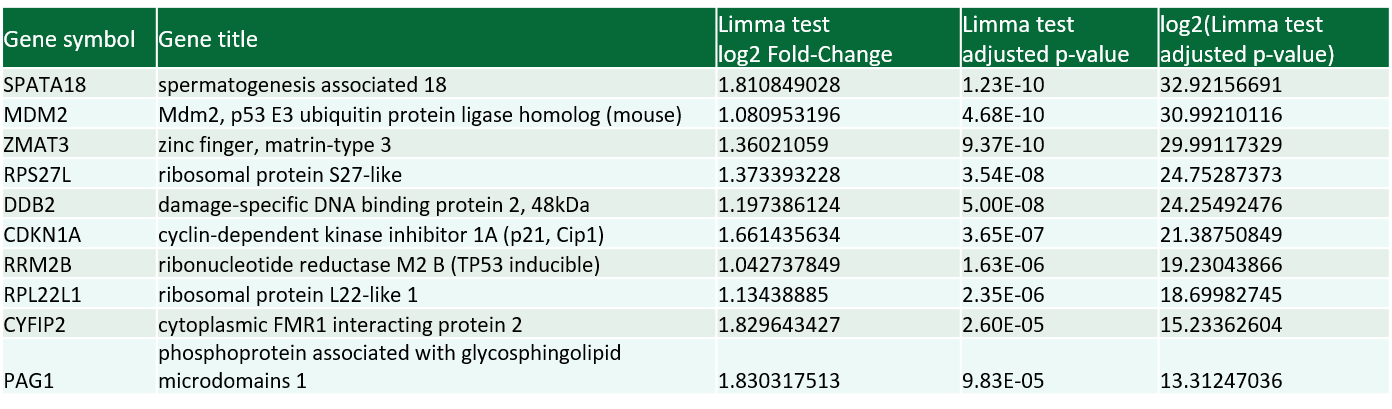
Gene expression analysis
- Excel table with raw data
- Graphical presentation of the correlation of the expression of each gene and drug sensitivity for every cell line
- Graphical presentation of the cluster analysis to identify differential gene expression signatures and different response rates to the test drug
- Optional: Literature search of gene function for most relevant genes
Additional analyses can be performed upon requests such as target gene analysis, pathway analysis, subtype analysis, hypothesis-driven analysis, predictive model development, and more.