Flow Cytometry Applications
Flow cytometry is a versatile tool that efficiently allows the investigation of cells after compound treatment based on changes in protein expression, protein localization, or protein modifications. For example, flow cytometry is used to quantify the activity of drug candidates via quantification of substrate modifications, including phosphorylation. Other cellular processes such as apoptosis or cell signaling can also be measured.
At Reaction Biology, flow cytometry can be conducted with cell culture, primary cells, tissue material, or blood. Our scientists have access to a full suite of state-of-the-art flow cytometers and cell sorters and can further analyze sorted cells via qPCR, immunofluorescence, or other readouts.
Our services include:
- Single-plex or multi-plex capacity with up to 20 markers
- Quantification of drug treatment effects on a cellular level
- Custom-tailored project design and assay development
- Fresh samples can be created in-house by our cell assay or animal testing teams
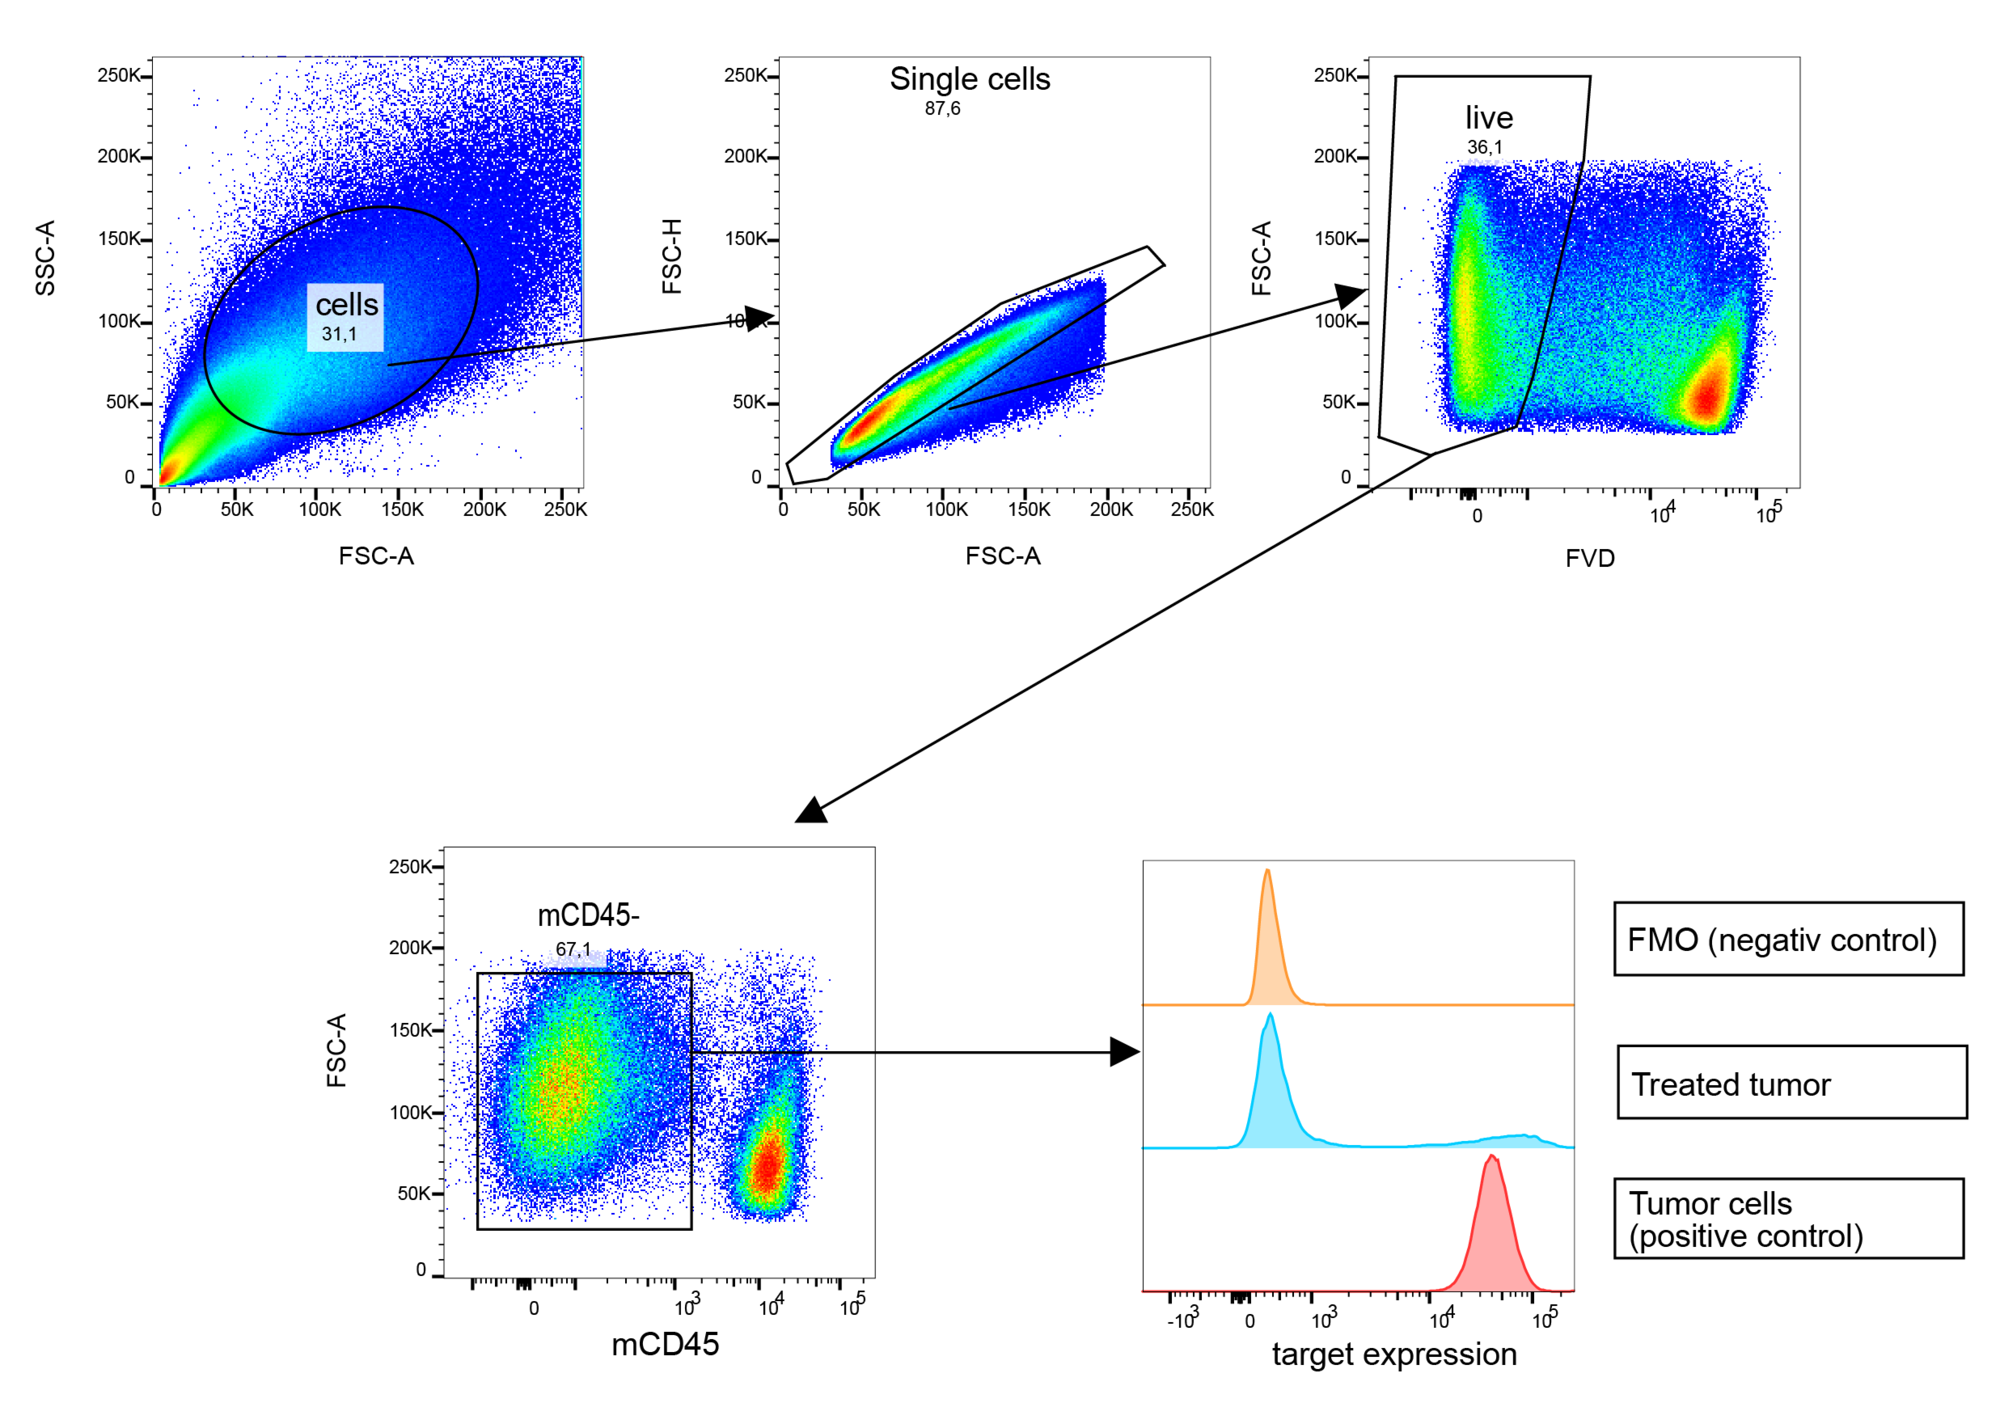
Information about flow cytometry of tumor material for immunophenotyping can be found here.
Connect with our scientists to find out how we can help you achieve your research goals and determine which methods are best suited to monitor the effects of your drug candidate.