List of Targets (53 total)
Target | HGNC name | Cell Line | Reference Compound | Assay Format | Info sheet |
---|---|---|---|---|---|
AKT1 | AKT1 | Rat1 | Staurosporine | transfected | Data sheet |
ALK | ALK | Karpas-299 | Crizotinib | endogenous | Data sheet |
Aurora-B | AURKB | HT-29 | Staurosporine | endogenous | Data sheet |
AXL | AXL | MEF | Sunitinib | transfected | Data sheet |
B-RAF-VE | BRAF (V600E) | Rat1 | Sorafenib | transfected | Data sheet |
BCR-ABL | BCR-ABL1 | K562 | Dasatinib | endogenous | Data sheet |
EGF-R | EGFR | A431 | Lapatinib | endogenous | Data sheet |
EGF-R (d746-750/C797S) | EGFR | Rat1 | Lapatinib | transfected | Data sheet |
EGF-R (d746-750/T790M) | EGFR | Rat1 | Lapatinib | transfected | Data sheet |
EGF-R (d746-750/T790M/C797S) | EGFR | Rat1 | Lapatinib | transfected | Data sheet |
EGF-R (d747-749/A750P) | EGFR | Rat1 | Staurosporine | transfected | Data sheet |
EGF-R (d752-759) | EGFR | Rat1 | Lapatinib | transfected | Data sheet |
EGF-R (G719S) | EGFR | Rat1 | Staurosporine | transfected | Data sheet |
EGF-R (L858R) | EGFR | Rat1 | Staurosporine | transfected | Data sheet |
EGF-R (L861Q) | EGFR | Rat1 | Staurosporine | transfected | Data sheet |
EGF-R (T790/L858R) | EGFR | Rat1 | Lapatinib | transfected | Data sheet |
EGF-R (T790M) | EGFR | Rat1 | Staurosporine | transfected | Data sheet |
EGF-R (T790M/C797S/L858R) | EGFR | Rat1 | Staurosporine | transfected | Data sheet |
EGF-R (wild type control) | EGFR | Rat1 | Lapatinib | transfected | Data sheet |
EPHB4 | EPHB4 | MEF | Sorafenib | transfected | Data sheet |
ERBB2 | ERBB2 | NIH3T3 | Lapatinib | transfected | Data sheet |
ERBB4 | ERBB4 | T47D | Lapatinib | endogenous | Data sheet |
FAK | PTK2 | MEF | Staurosporine | transfected | Data sheet |
FGF-R2 | FGFR2 | Kato III | Nintedanib | endogenous | Data sheet |
FLT3 (DY) | FLT3 | MEF | Sunitinib | transfected | Data sheet |
FLT3 (ITD) | FLT3 | MEF | Sunitinib | transfected | Data sheet |
FLT3 (wild type control) | FLT3 | MEF | Sunitinib | transfected | Data sheet |
FYN | FYN | Rat1 | CHR 6494 | transfected | Data sheet |
Haspin | GSG2 | HT-29 | Dasatinib | endogenous | Data sheet |
IGF1-R | IGF1R | MEF | Staurosporine | transfected | Data sheet |
KIT | KIT | M07e | Sunitinib | endogenous | Data sheet |
MET | MET | MKN45 | PHA665752 | endogenous | Data sheet |
MET (D1228N) | MET | Rat1 | BMS777607 | transfected | Data sheet |
MET (D1288H) | MET | Rat1 | BMS777607 | transfected | Data sheet |
MET (F1200l) | MET | Rat1 | BMS777607 | transfected | Data sheet |
MET (M1250T) | MET | Rat1 | BMS777607 | transfected | Data sheet |
MET (wild type control) | MET | Rat1 | BMS777607 | transfected | Data sheet |
MET (Y1230A) | MET | Rat1 | BMS777607 | transfected | Data sheet |
MET (Y1230C) | MET | Rat1 | BMS777607 | transfected | Data sheet |
MET (Y1230D) | MET | Rat1 | BMS777607 | transfected | Data sheet |
MET (Y1230H) | MET | Rat1 | BMS777607 | transfected | Data sheet |
MNK1 | MNK1 | Karpas-299 | CGP 57380 | endogenous | Data sheet |
PDGFR-beta | PDGFRB | NIH3T3 | Sunitinib | transfected | Data sheet |
PIM1 | PIM1 | HEK293T | AZD1208 | transfected | Data sheet |
PIM2 | PIM2 | HEK293T | AZD1208 | transfected | Data sheet |
PIM3 | PIM3 | HEK293T | AZD1208 | transfected | Data sheet |
ROCK | ROCK1 and ROCK2 | A7r5 | Y27632 | endogenous | Data sheet |
RON | MST1R | T47D | Crizotinib | endogenous | Data sheet |
S6K | RPS6KB1 | Karpas-299 | Everolimus | endogenous | Data sheet |
SRC | SRC | MEF | Dasatinib | transfected | Data sheet |
TIE2 | TEK | CHO | Sorafenib | transfected | Data sheet |
VEGF-R2 | KRD | HUE | Sunitinib | endogenous | Data sheet |
VEGF-R3 | FLT4 | MEF | Sunitinib | transfected | Data sheet |
Assay Details

Assay principle on the example of the VEGF-R2 assay.
Human endothelial cells express endogenous VEGF-R2. Compounds are added to the serum-free cell culture medium via nanodrop dispenser and the cells incubate with the test compound for 90 minutes to allow for target binding. After a 3-minute stimulation with ligand VEGF-A, cells are lysed and the substrate phosphorylation is quantified by ELISA with pan-phospho-tyrosine antibodies on captured VEGF-R2. The assay is performed with 8 compound concentrations in duplicate for IC50 value determination.

Assay with transfected kinase constructs.
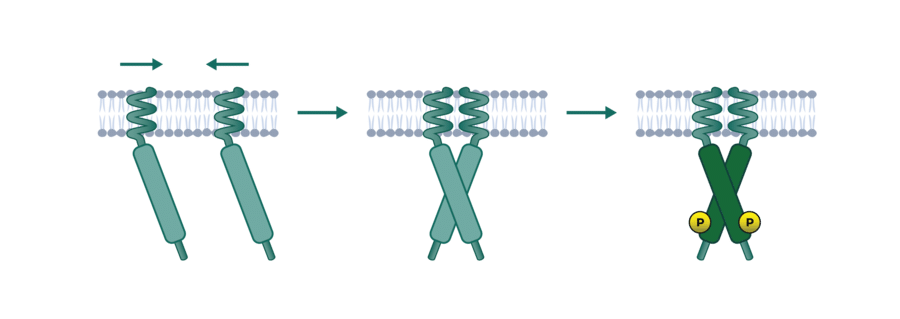
To provide a panel of kinase mutants we transfected fibroblasts to stably express the intracellular domain of receptor kinase mutants fused to an artificial transmembrane domain. Dimerization of the receptors causes constitutive auto-phosphorylation that can be interrupted by a specific kinase inhibitor and quantified via ELISA.
Mutant panels are available for EGF-R, MET and FLT3.
Setups: IC50 value determination.
Controls: DMSO only control serves as high control. Quality assurance is provided by calculation of Z' factors for low/high controls on each assay plate and by including a full IC50 curve of a kinase-specific reference inhibitor to monitor adequate dose/response relation in your assay run.
Custom assay development: Assays that are not part of the list can be established according to the client’s research needs.
Turnaround time for standard studies is about 2 to 3 weeks.
Report: We provide a detailed report including materials, methods, raw data, and graphical presentation of IC50 dose-response curves.
Screening facility: The assay is performed in Freiburg, Germany.
Compound requirements: Compound requirements in brief: 30 µl of the stock solution with 1000x of the highest assay concentration or the equivalent of solid material.
The Plasma Inhibitory Assay (PIA) is used to determine the impact of the presence of plasma on the performance of kinase inhibitors.
The PIA Assay can be performed with two setups:
In vitro: The cell-culture medium is supplemented with blood plasma during the performance of the Cellular Phosphorylation Assay.

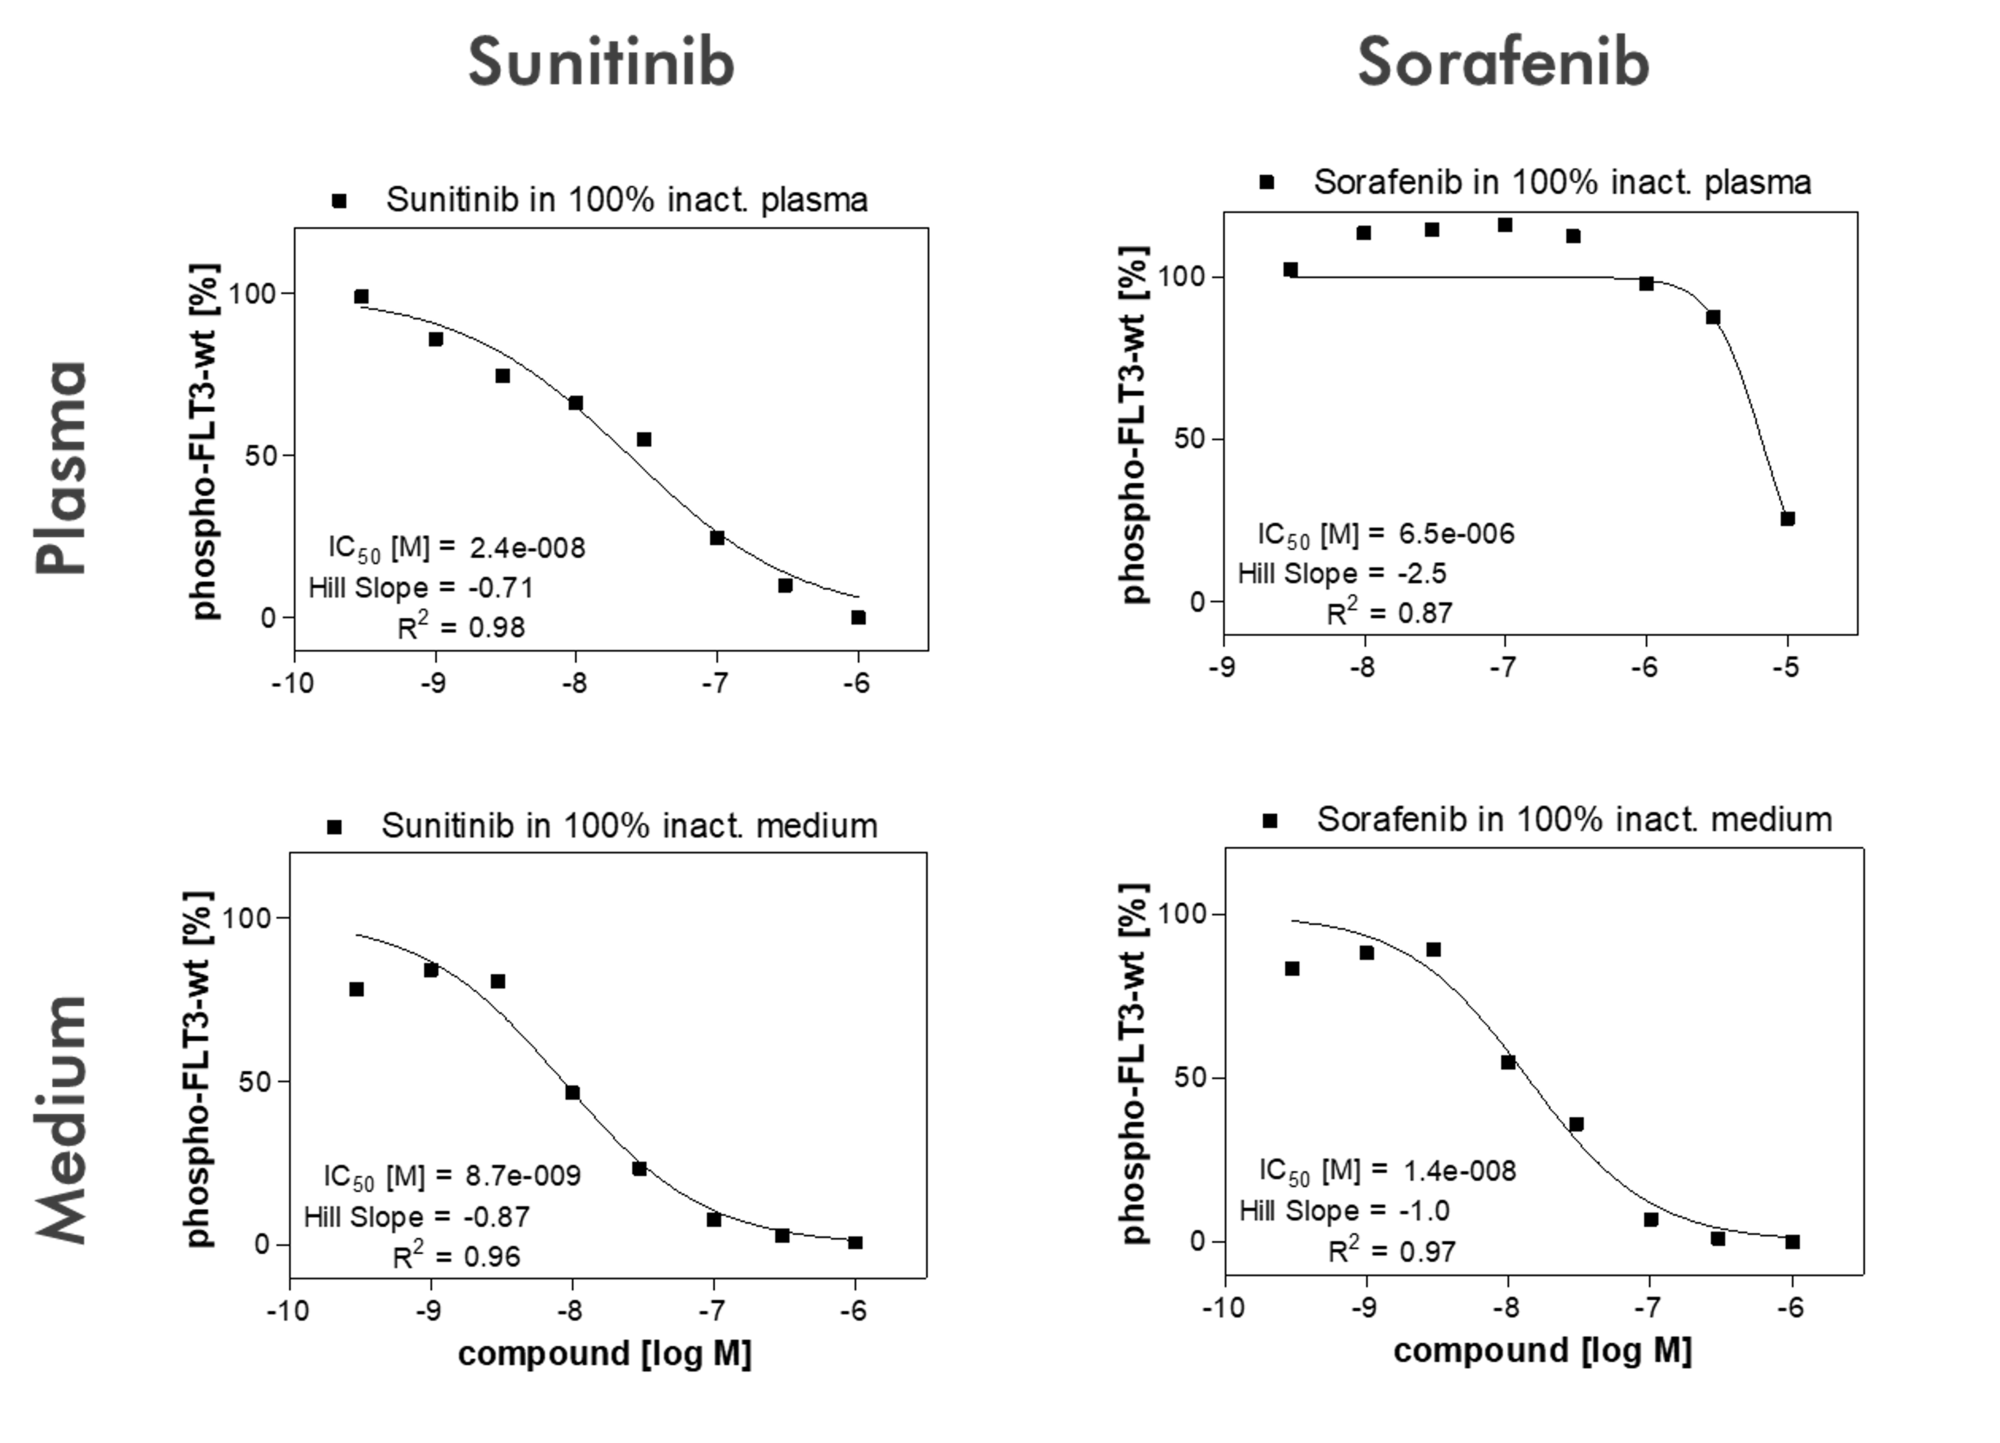
After heat inactivation of plasma and medium, dose-response curves could be generated in the cellular phosphorylation assay. The activity of Sunitinib as a molecule with low plasma binding is only slightly affected by the presence of human plasma. The activity of Sorafenib which has a high plasma binding is reduced more than 460fold in the presence of human plasma.
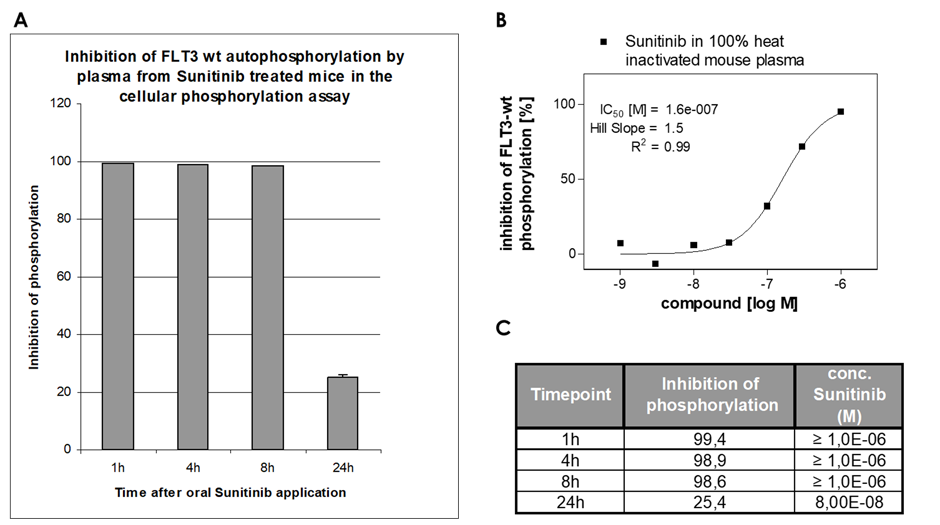
In vivo: The drug is administered to a mouse and its blood is used for quantification of the amount of functional inhibitor in the blood.

A) The inhibitory effect on FLT3 autophosphorylation was assessed for plasmas from mice taken at four different time points after oral application of Sunitinib (80mg/kg). B) The dose-response curve for Sunitinib spiked in mouse plasma is shown as a control. C) The concentration of Sunitinib in mouse plasma after different time points.